Fleet Repairs, Claims Inflation & EV Costs: 2025 Insights from our UK Customer Forum

After hosting our first ever Customer Forum for fleet professionals, we’re reflecting on what was an insightful and highly valuable event for our customers.
As one of the UK’s leading fleet accident management providers, sopp+sopp designed Fleet Connect to share real data, practical strategies and industry expertise with our customers.
During the course of the day Fleet Connect brought together a wide range of industry experts who provided a data driven look at a range of relevant topics, including claims inflation, sector risk, liability trends and the true cost of missed intervention opportunities.
While our external speaker sessions and panel discussions remain exclusive to forum attendees, we are excited to share valuable discussion points from key sessions headed by the sopp+sopp team.
In this article we cover selected insights from our in-house-experts on claims and repair trends. These insights include data gathered by sopp+sopp, as well as wider-industry trends.
We’ll also share some reflections on the day from our Managing Director, Callum Langan, as well as some of the fantastic feedback we’ve received from attendees.
Vehicle Repairs: Lower Volumes, Higher Complexity
During the sessions hosted by sopp+sopp’s internal experts, we analysed 2025 repair data across multiple sectors, and found that clear new trends are emerging throughout the industry.
Repair Volumes: A Structural Shift
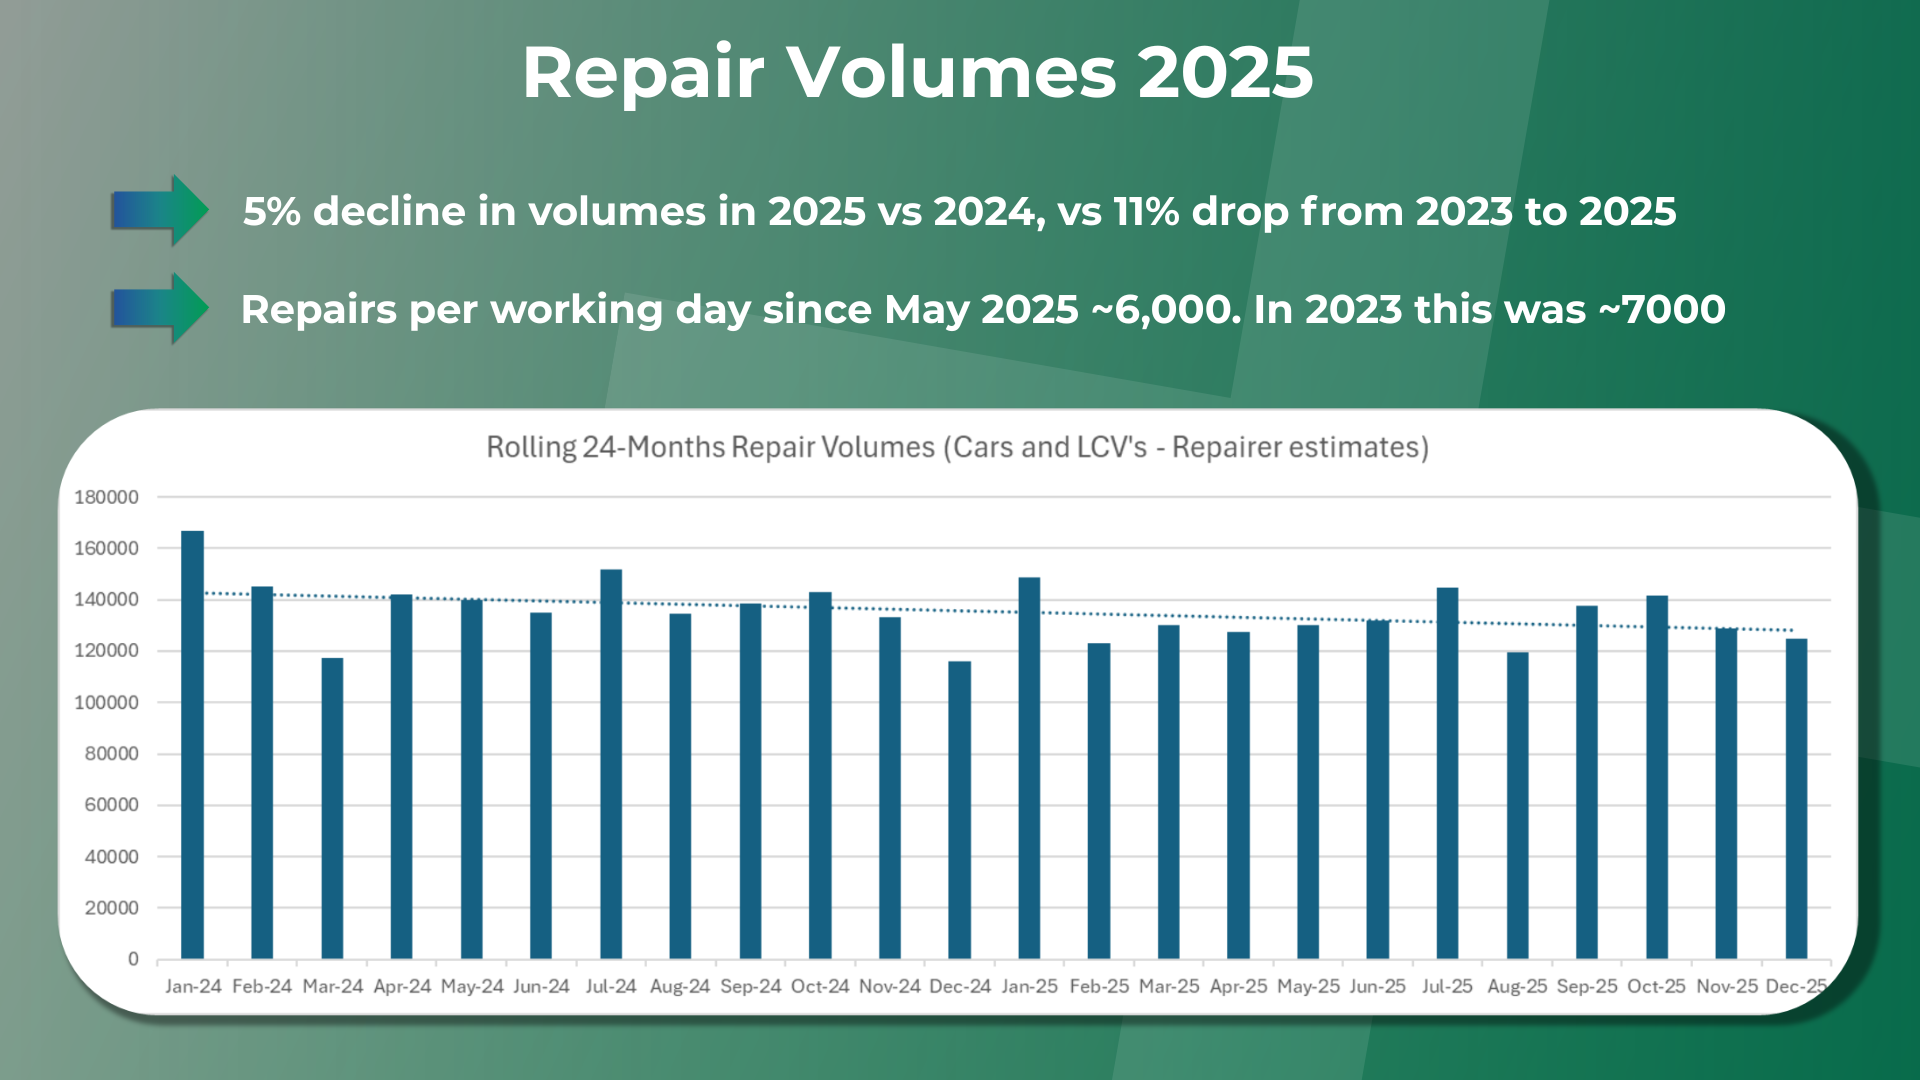
One of the clearest industry trends discussed is the continued decline in repair volumes.
In 2025, repair volumes fell by 5% compared to 2024. This follows a wider 11% reduction between 2023 and 2025. Repairs per working day have stabilised at approximately 6,000 per day, down from around 7,000 in 2023.
This is not seasonal fluctuation; it reflects structural change driven by:
Improved road safety and reduced minor collision frequency
Expansion of speed enforcement (over 7,000 UK speed cameras now operating across the UK)
Widespread adoption of ADAS and collision-avoidance technology
Shifts in consumer behaviour driven by high insurance premiums
Increased total loss or “write-off” decisions on damaged vehicles by insurers
However, while fewer vehicles are entering repair, cost pressures remain significant.
Cycle Time Performance: Best Since 2021
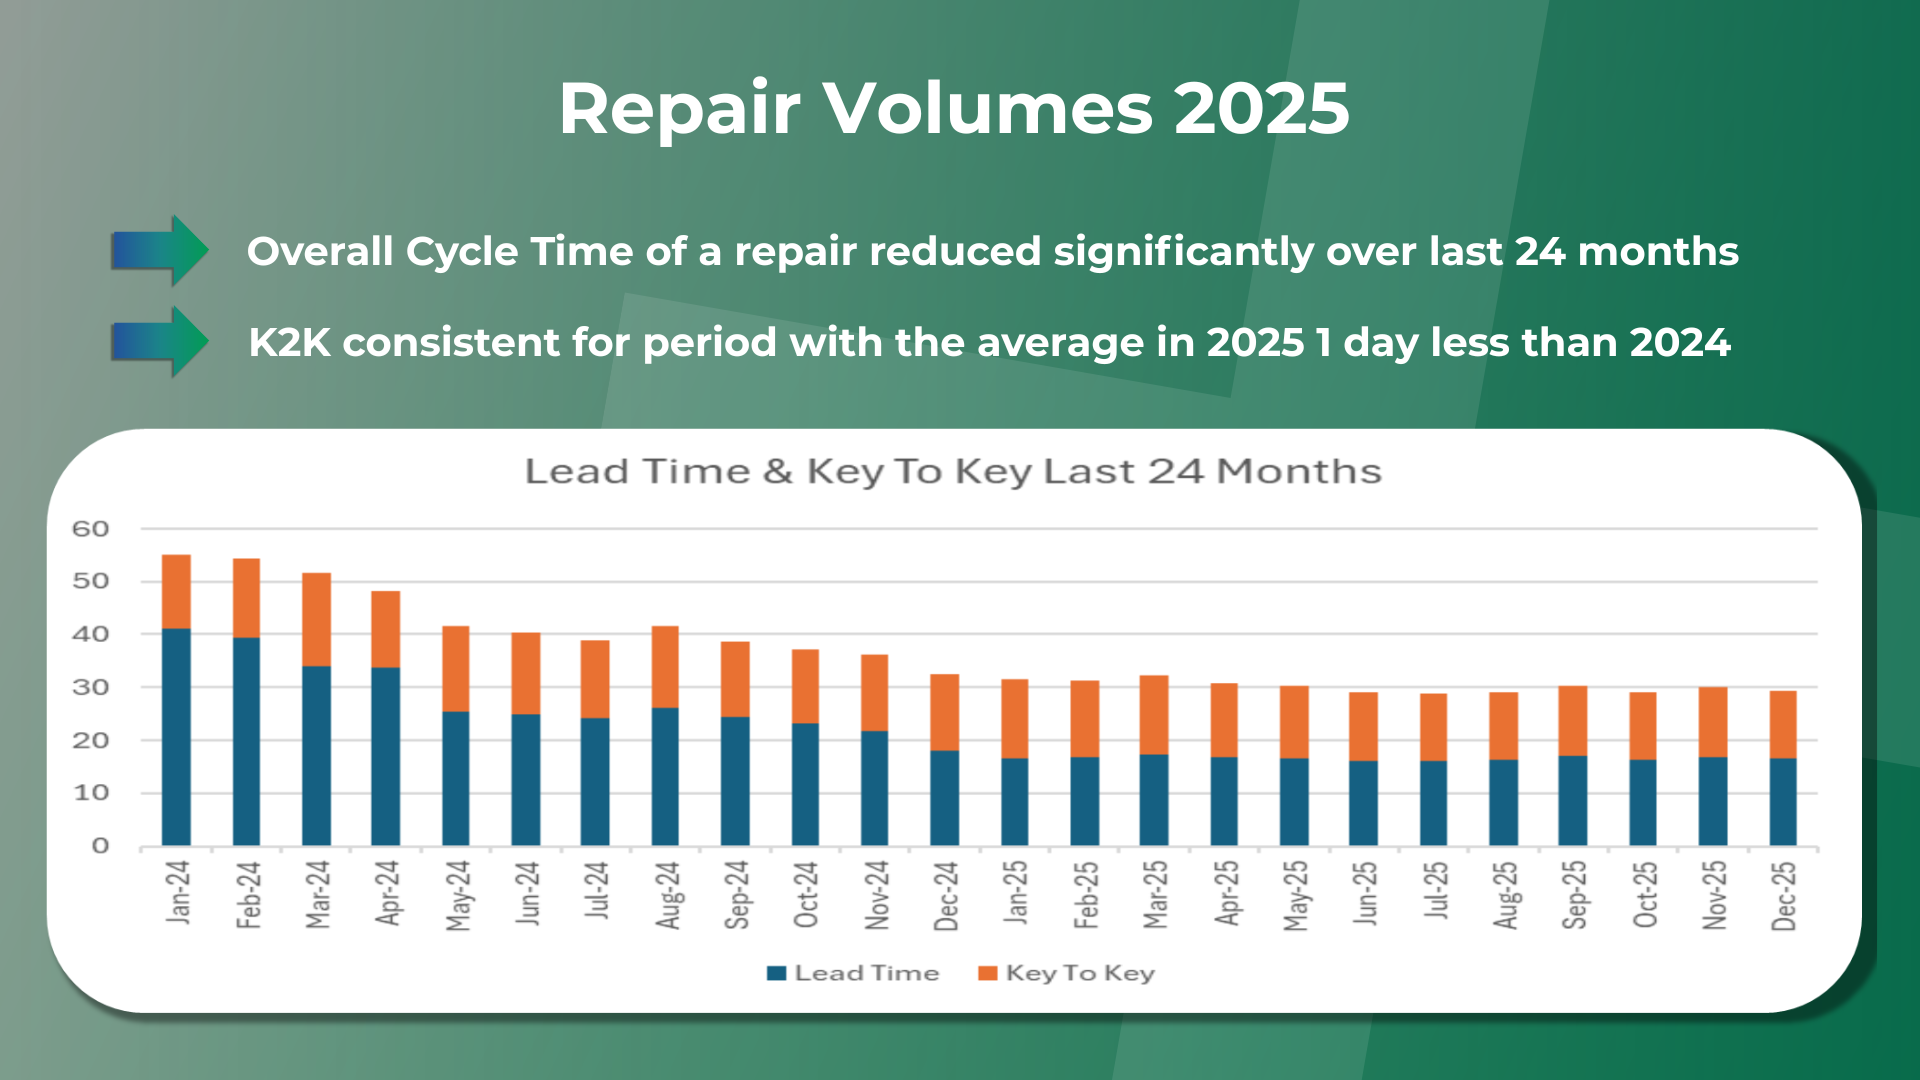
Encouragingly, repair cycle times have improved significantly over the past 24 months. 2025 represents the strongest Key-to-Key performance since summer 2021, with average cycle times one day shorter than 2024.
This improvement reflects a combination of:
Reduced demand creating market capacity
150 new repair sites added in 2024 – (Activate Group contributed several of these.)
Operational process improvements and enhanced front-end triage
Increased use of SMART and mobile repair solutions
Continued “repair over replace” philosophy
These gains demonstrate what can be achieved when capacity, operational efficiency and strategic repair routing align.
Mobile Repairs: Tangible Cost & Downtime Savings
One of the most compelling insights shared at Fleet Connect was the measurable impact of proactive mobile repair routing.
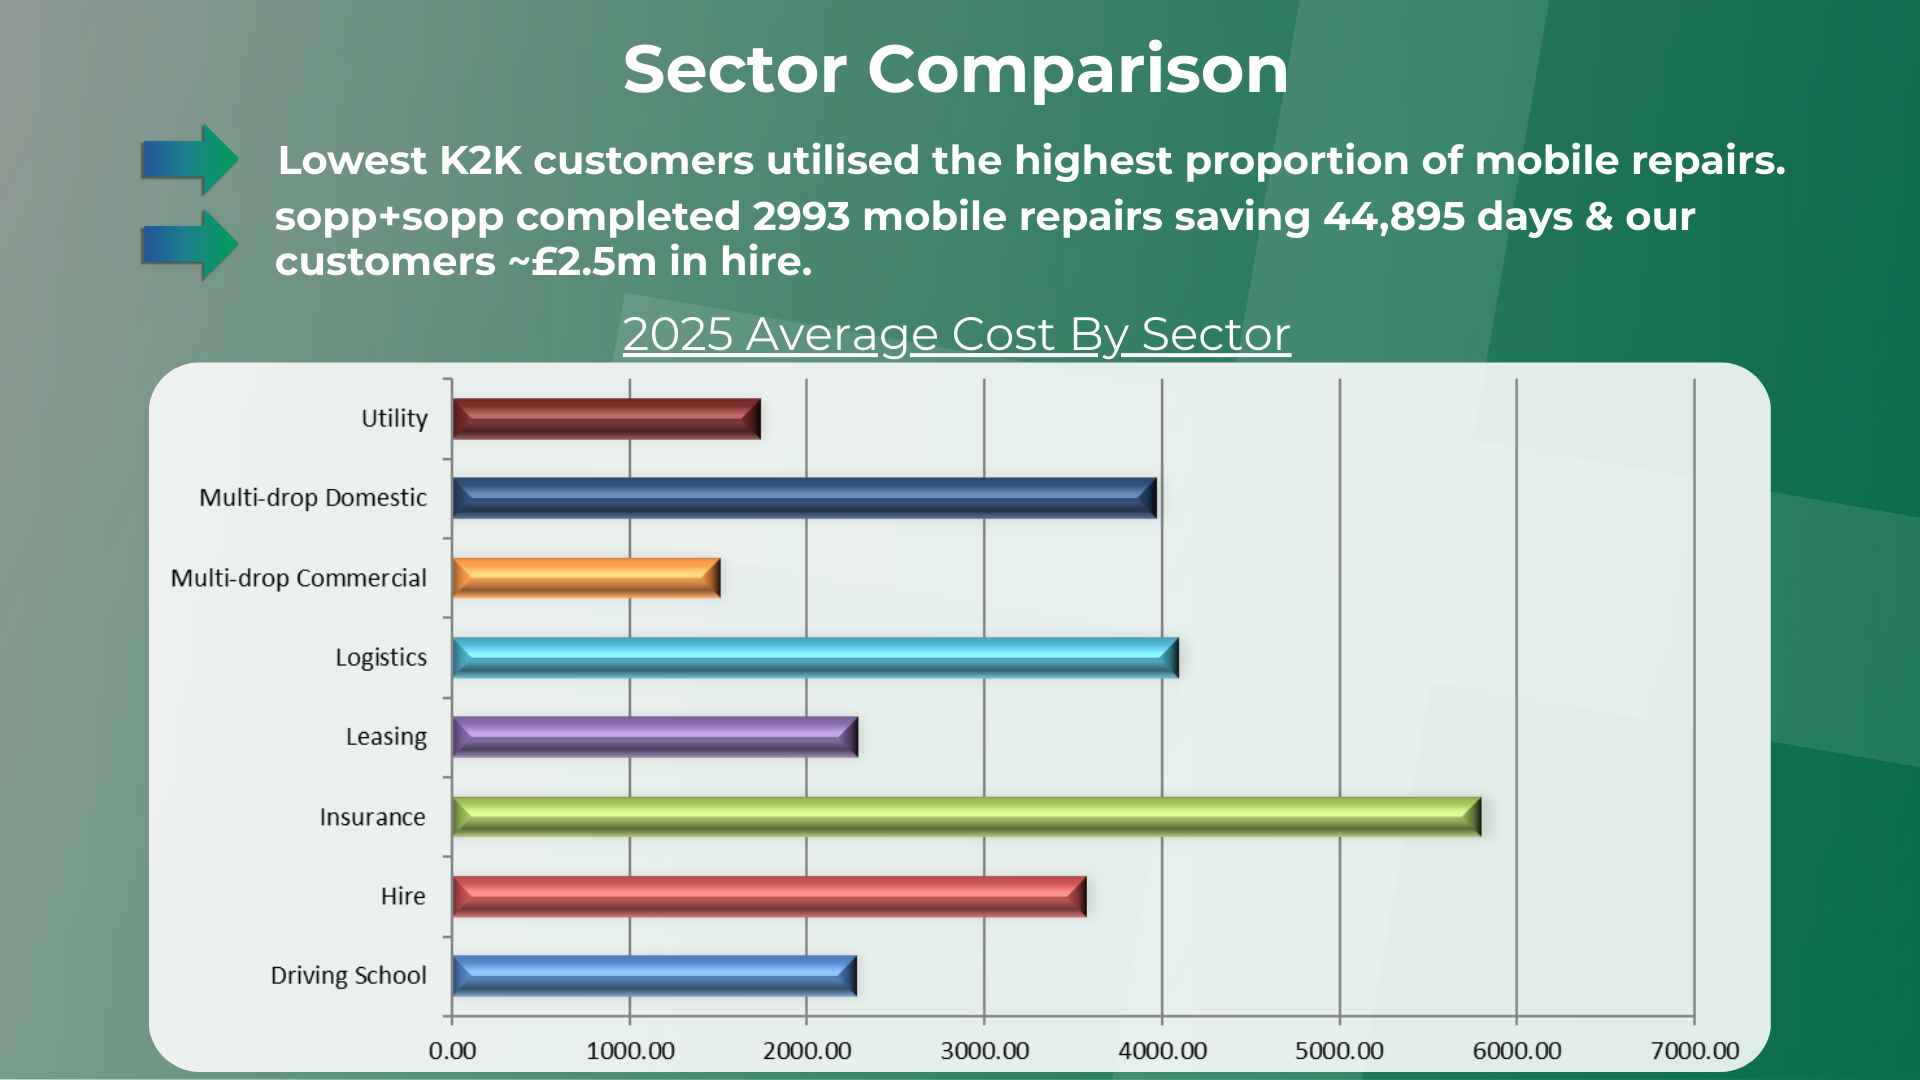
In 2025 alone:
2,993 mobile repairs completed
44,895 days of downtime saved
Approximately £2.5 million saved in hire costs
The fleets achieving the lowest Key-to-Key times were consistently those utilising higher proportions of mobile repair solutions. Proactive repair routing has delivered these fleets measurable financial impact while minimising operational disruption.
For commercial fleets, vehicle downtime is not simply a hire cost. It means lost productivity, operational disruption and driver inefficiency. Proactive repair strategy is therefore an operational and financial necessity.
Repair Cost Inflation & EV Transition
Despite falling repair volumes, average repair costs increased 4.4% year-on-year.
Key drivers include:
Increased complexity and integration of vehicle technology
Higher labour and calibration costs
Semiconductor and sensor cost pressures
AI-driven system complexity
The growing transition to Electric LCVs is accelerating these trends:
Electric LCV repair costs increased 8.9% year-on-year
EV LCV repairs are 32% more expensive than internal combustion (ICE) equivalents
With 30% of new UK fleet vehicle orders now electric, the long-term cost implications for fleets, insurers and self-insured operators are significant.
At the same time, the repair industry faces a growing skills challenge. While apprentice numbers are rising, it is estimated that 76,000 additional EV technicians will be required by 2030 to meet demand. Without accelerated upskilling, capacity bottlenecks may emerge.
Claims, Liability & The True Cost of Missed Opportunities
During another session hosted by sopp+sopp’s internal experts, we analysed 2025 claims and liability data across multiple fleet sectors, and the findings were striking.
The Inflation Reality

Although claims frequency is falling, claims inflation remains a significant industry challenge.
Third-party claims costs have risen steadily from 2020 to 2025, driven by post-pandemic labour costs, supply chain disruption and broader economic pressures.
The sharpest post-pandemic spikes have now subsided, but cumulative cost growth remains evident across labour, parts and third-party damage categories.
In short: fewer claims does not mean lower financial risk.
Sector Risk: Beyond Accident Frequency
An important factor in managing claims costs is understanding the road traffic accident risk associated with different kinds of fleets.
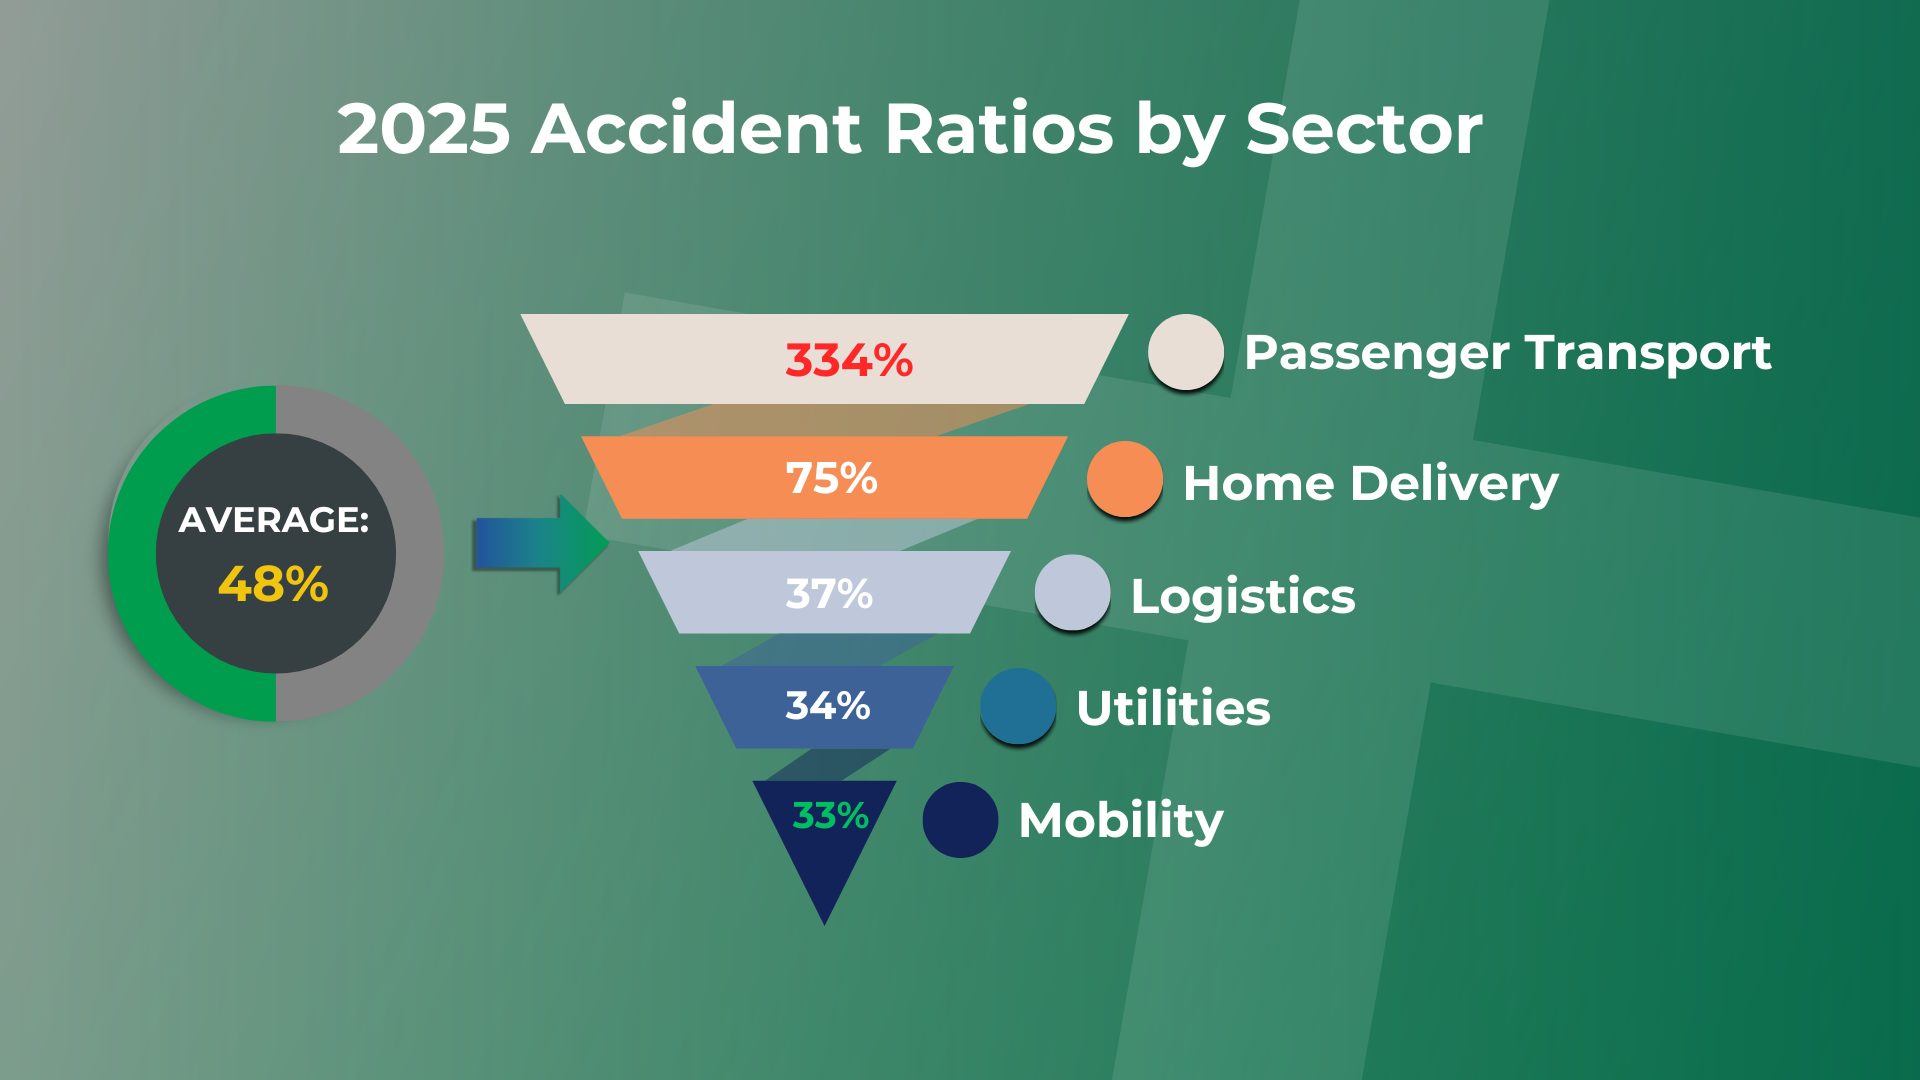
Across sopp+sopp’s 2025 fleet matrix, we broke down the reported incident ratio by fleet sector.
Here are some of the key incident ratio numbers we found:
Overall accident ratio across all fleets: 48%
Mobility fleets: 33%
Home delivery fleets: 75%
Passenger transport: 334 accidents per 100 vehicles annually
These figures show that passenger transport vehicles are over ten times more likely to be involved in an accident than mobility fleets.
At face value, this would make passenger transport vehicles among the most high-risk fleet types on the road. However, frequency of incidents alone is not a reliable indication of risk or claim costs.
Sector Liability Trends
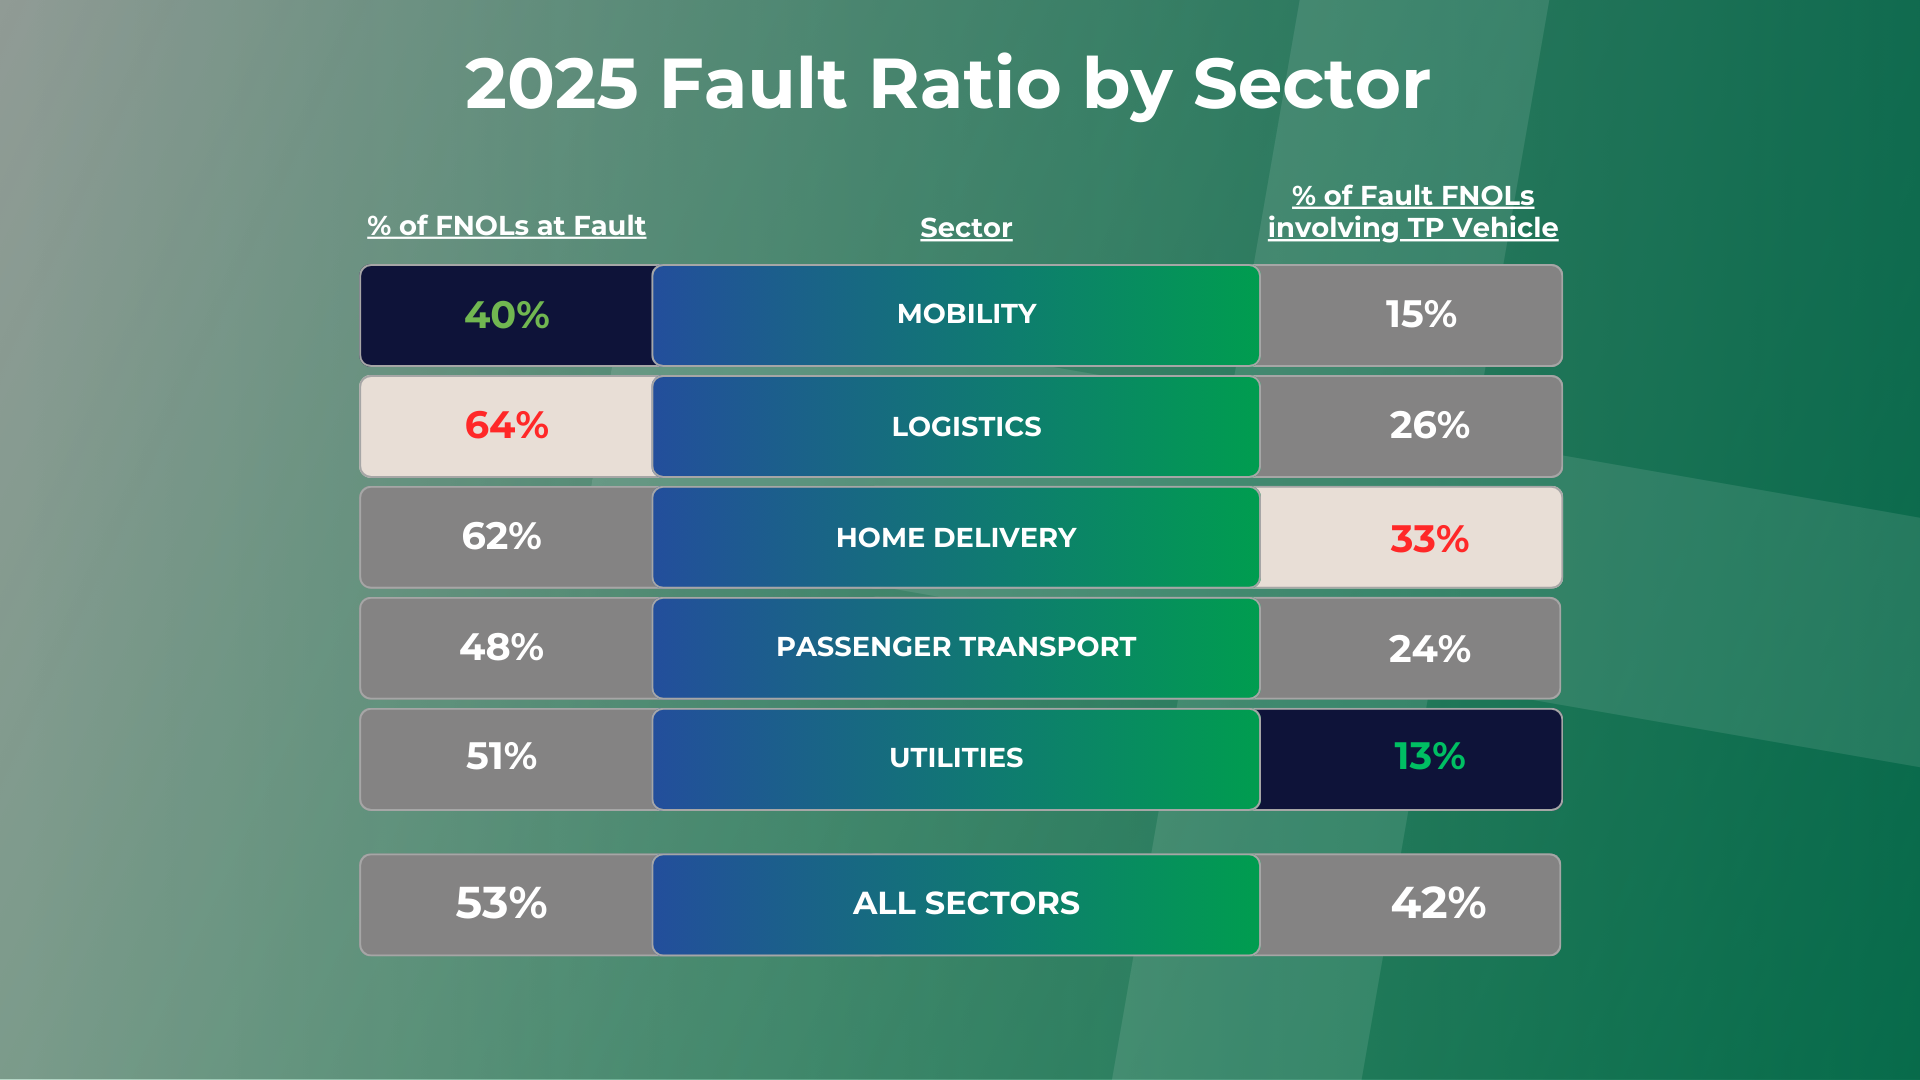
A clearer idea of risk forms when analysing fault ratios and third-party involvement. It’s important to note that different fleet sectors behave very differently when it comes to fault liability:
Mobility fleets recorded the lowest proportion of fault accidents. Even where they were at fault, only 15% involved a third-party vehicle- significantly reducing the likelihood of high-value third-party claims.
Logistics and home delivery fleets recorded the highest proportion of fault incidents.
Home delivery fleets stood out for having the highest percentage of fault accidents involving another vehicle; meaning a greater exposure to costly third-party damage and credit hire claims.
Utilities fleets showed a different pattern: around half of accidents were fault-based, but only 1 in 4 involved another vehicle, suggesting a higher proportion of third-party property damage.
These differences highlight how vehicle usage, route characteristics and driver behaviour all influence risk, and why insurance strategy must be tailored by sector.
2025 Liability by Vehicle Type

One of the most interesting findings was that liability trends did not align exactly with vehicle size.
While we expected buses and HGVs to behave similarly (and cars and LCVs to do the same) the data told a different story.
Cars were the only vehicle type with a significantly different liability split.
This suggests that driver behaviour and vehicle “ownership mentality” may be more influential than vehicle profile alone. Company car drivers, for example, often treat vehicles with greater care than drivers assigned different vans daily. Visibility, maneuverability and familiarity also play a role.
Reporting Speed vs Reporting Quality
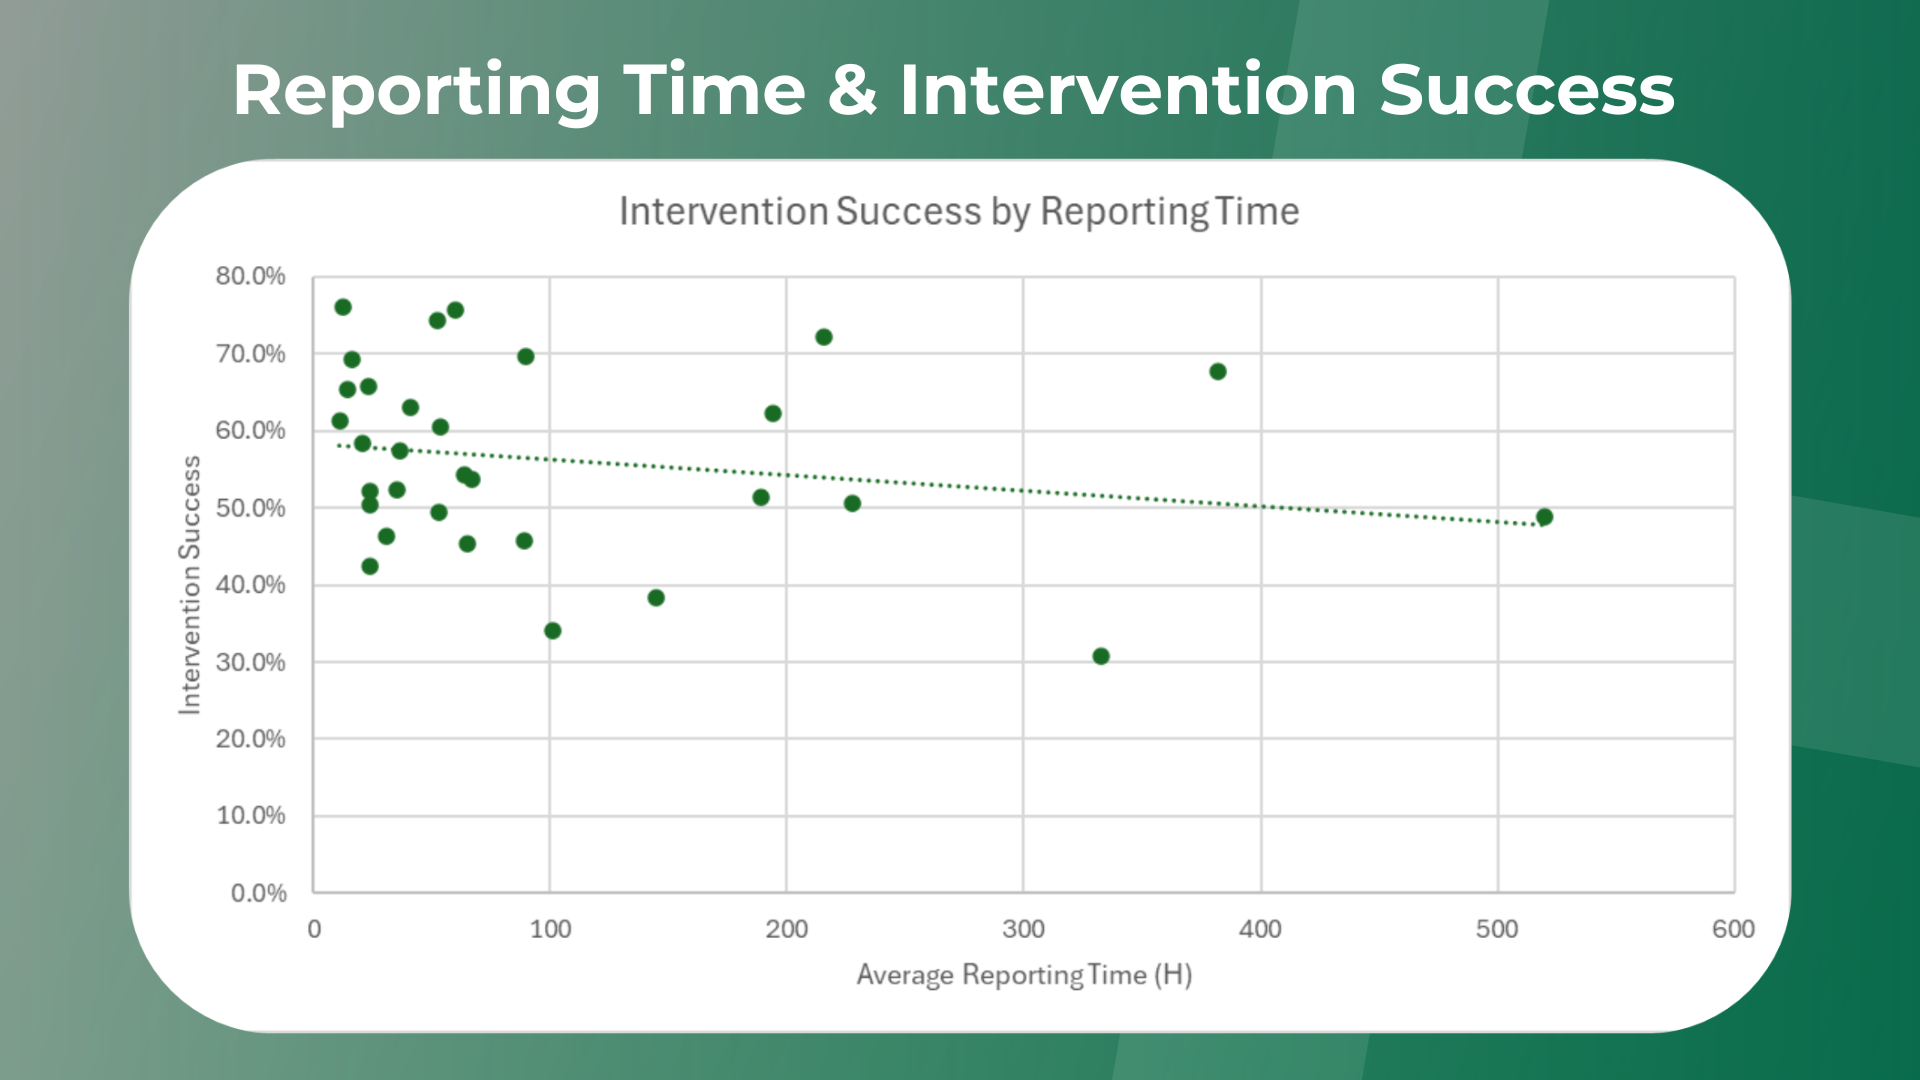
It’s widely accepted in fleet claims management that faster reporting improves intervention success, and our 2025 data supports that correlation.
Customers who consistently reported incidents quickly generally achieved higher third-party capture rates.
However, speed alone isn’t enough.
We found customers reporting within similar time-frames achieving very different intervention outcomes. This points to the importance of quality of reporting, including:
Accurate third-party details
Clear roadside communication
Proper use of bump cards
Setting expectations with third parties
Without quality information, even the fastest FNOL cannot maximise capture success.
2025 Fault Conversion: The Cost of Missed Intervention
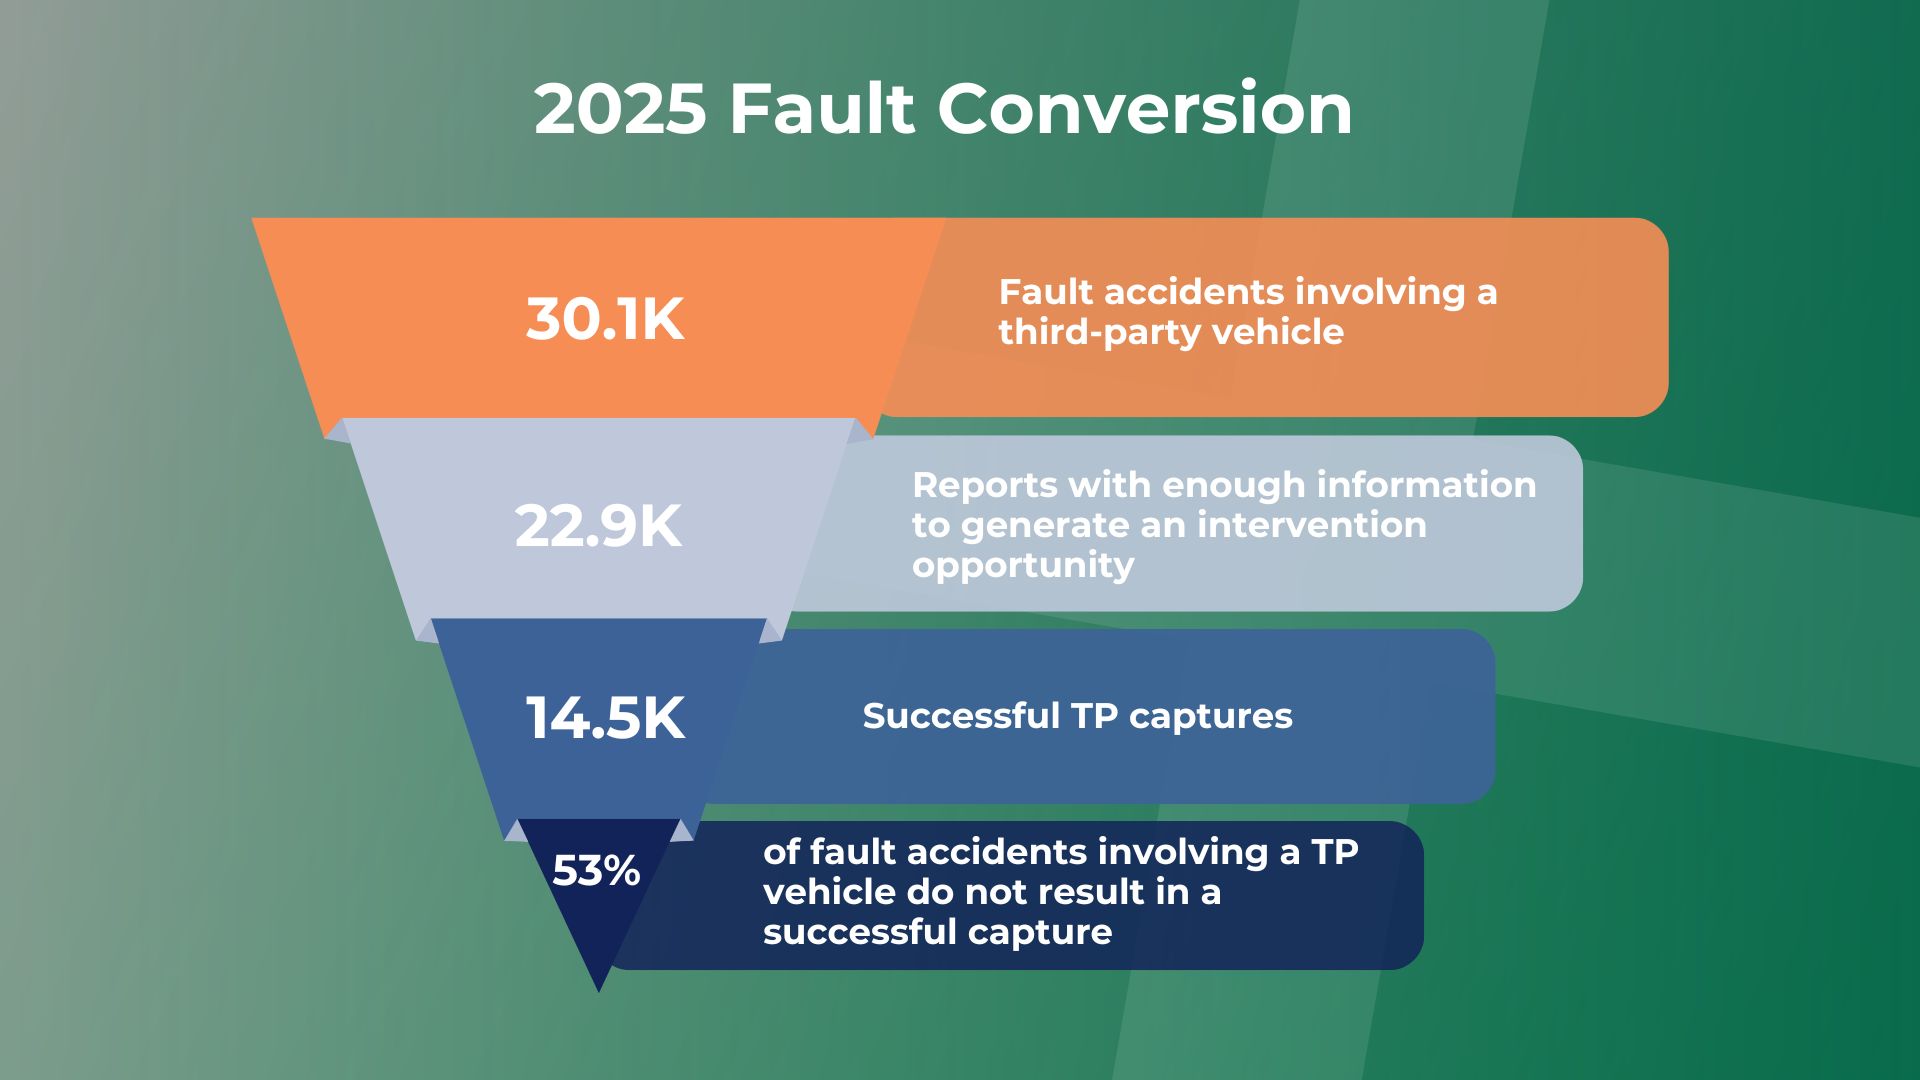
Based on 2025 FNOL data:
Over 30,000 fault accidents involved third parties
sopp+sopp received sufficient contact details on fewer than 23,000
24% of intervention opportunities were lost immediately
Only 14,500 were successfully converted into third-party captures
That left 15,600 fault third-party accidents unmanaged.
At a conservative £1,500 saving per avoided credit hire/repair claim, this represents a potential missed saving of over £24.4 million in 2025 alone.
Uninsured Loss Recovery (ULR) – Another £13.7M Opportunity
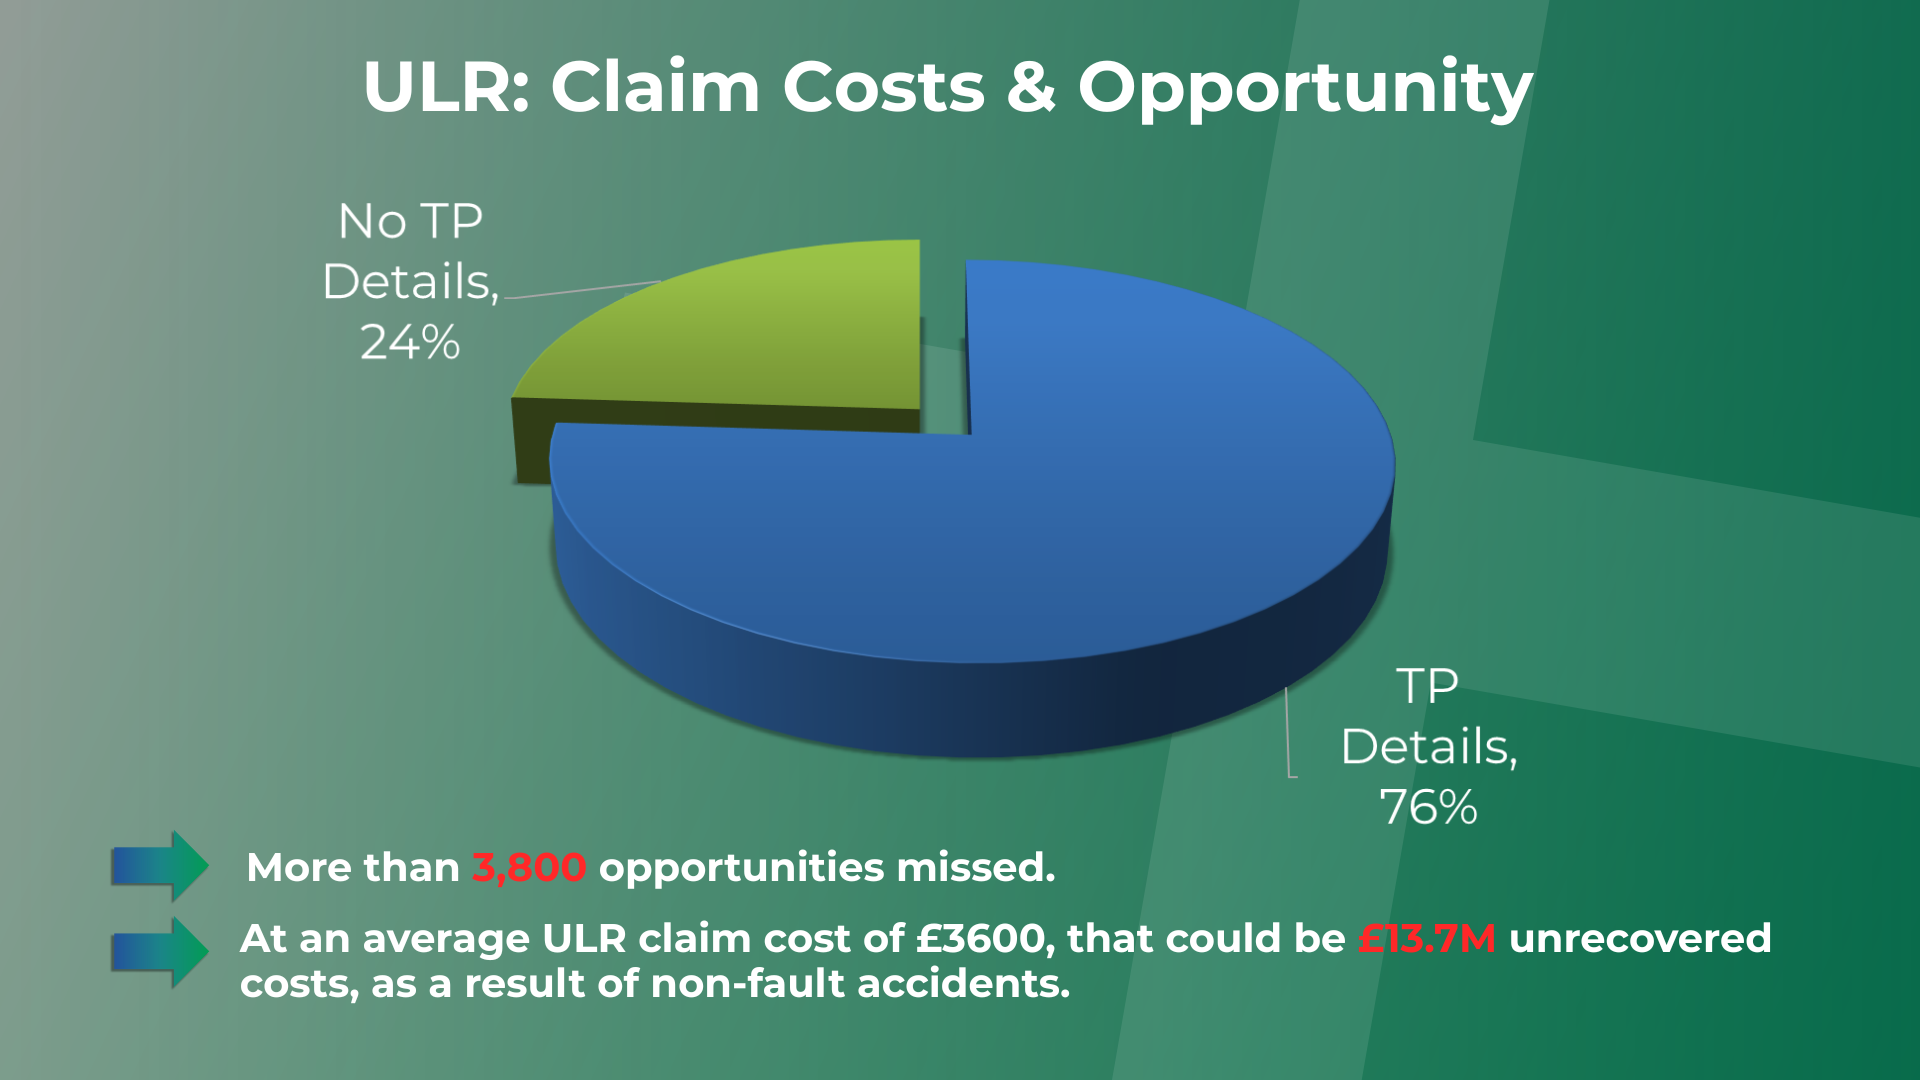
For non-fault accidents involving third parties:
Third-party details were missing in 24% of cases
That equates to more than 3,800 unrecovered opportunities
At an average ULR value of £3,600, this represents £13.7 million in unrecovered costs
Combined, missed intervention and missed non-fault recovery could represent more than £38 million in lost opportunity in 2025.
For fleet operators and insurers alike, this fundamentally shifts the conversation from accident frequency alone to data quality, reporting culture and behavioural change.
Exclusive Industry Expertise for Forum Attendees

In addition to our internal insights, attendees heard from a range of respected external industry experts in sessions that were exclusive to the forum.
Topics included:
Driver health and behavioural change with Dr Lisa Dorn
The importance of driver physical health in road safety with Dr Grant Charlesworth Jones
Accident prevention, brand reputation and preventing fatalities on UK roads with Mark Cartwright
Electric vehicles and the evolving UK mobility landscape with James Fisher
We also hosted two specialist panel discussions:
Repair and Cost Control
Incident Reporting and Claims Management
These sessions encouraged open discussion around operational pressures, compliance challenges and emerging risks- providing attendees with practical perspectives and insights to take back to their own organisations.
What Our Attendees Said

The response to the forum has been overwhelmingly positive so far, with attendees highlighting both the insight shared and the collaborative environment created.
Dr Lisa Dorn’s session on driver health and behavioural change has generated notable engagement, with at least one guest exploring how her recommendations could be implemented into their own Health & Safety protocols.
The panel discussions seem to have reinforced an appetite for transparent, cross-industry dialogue. There is a clear recognition among our guests that managing rising repair complexity, EV cost exposure and claims inflation requires collaboration rather than isolated decision-making.
Perhaps most excitingly for us, we have already begun to be asked about continuing the forum in the future, with strong interest in following-up discussions on specific service areas.
Reflections on the Day: Callum Langan

“What made the day so powerful wasn’t just the insight we shared, but the quality of the discussion it sparked. We talked openly about the realities of 2025 (declining repair volumes, rising complexity, EV cost pressures, missed intervention opportunities) and, more importantly, what fleets can do about it.”
The industry is changing fast. Vehicle technology is more advanced, EV adoption is accelerating, and the cost landscape continues to evolve. Accident management can no longer be reactive; it has to be strategic and data-led.
What I was most encouraged by was the appetite in the room to challenge thinking, explore new approaches and work collaboratively. That’s how we’ve always operated– openly, proactively and with a continuous improvement mindset.
This wasn’t just an isolated event. It was the start of a bigger conversation about how we raise standards across the fleet industry. And we’re already looking forward to doing it again.”
Callum Langan, Managing Director of sopp+sopp
Looking Ahead

Our first Customer Forum reinforced the importance of collaboration, transparency and shared insight across the fleet industry.
By combining real claims data with behavioural insight and expert opinion, we’re hoping that Fleet Connect helped to give our customers valuable insights to allow them to move beyond reactive claims management and towards proactive risk and cost control strategies.
We look forward to building on this momentum and continuing to share insights that help our customers reduce accident costs, improve intervention success and strengthen their fleet risk management approach.